Michigan Counties by Area: Complete Rankings by Land & Water Square Miles (1 to 83)
Official geographical rankings of all 83 Michigan counties ranked from largest to smallest by square mileage. Discover land areas, Great Lakes water territorial boundaries, percentage water coverage, and instant PDF map downloads.
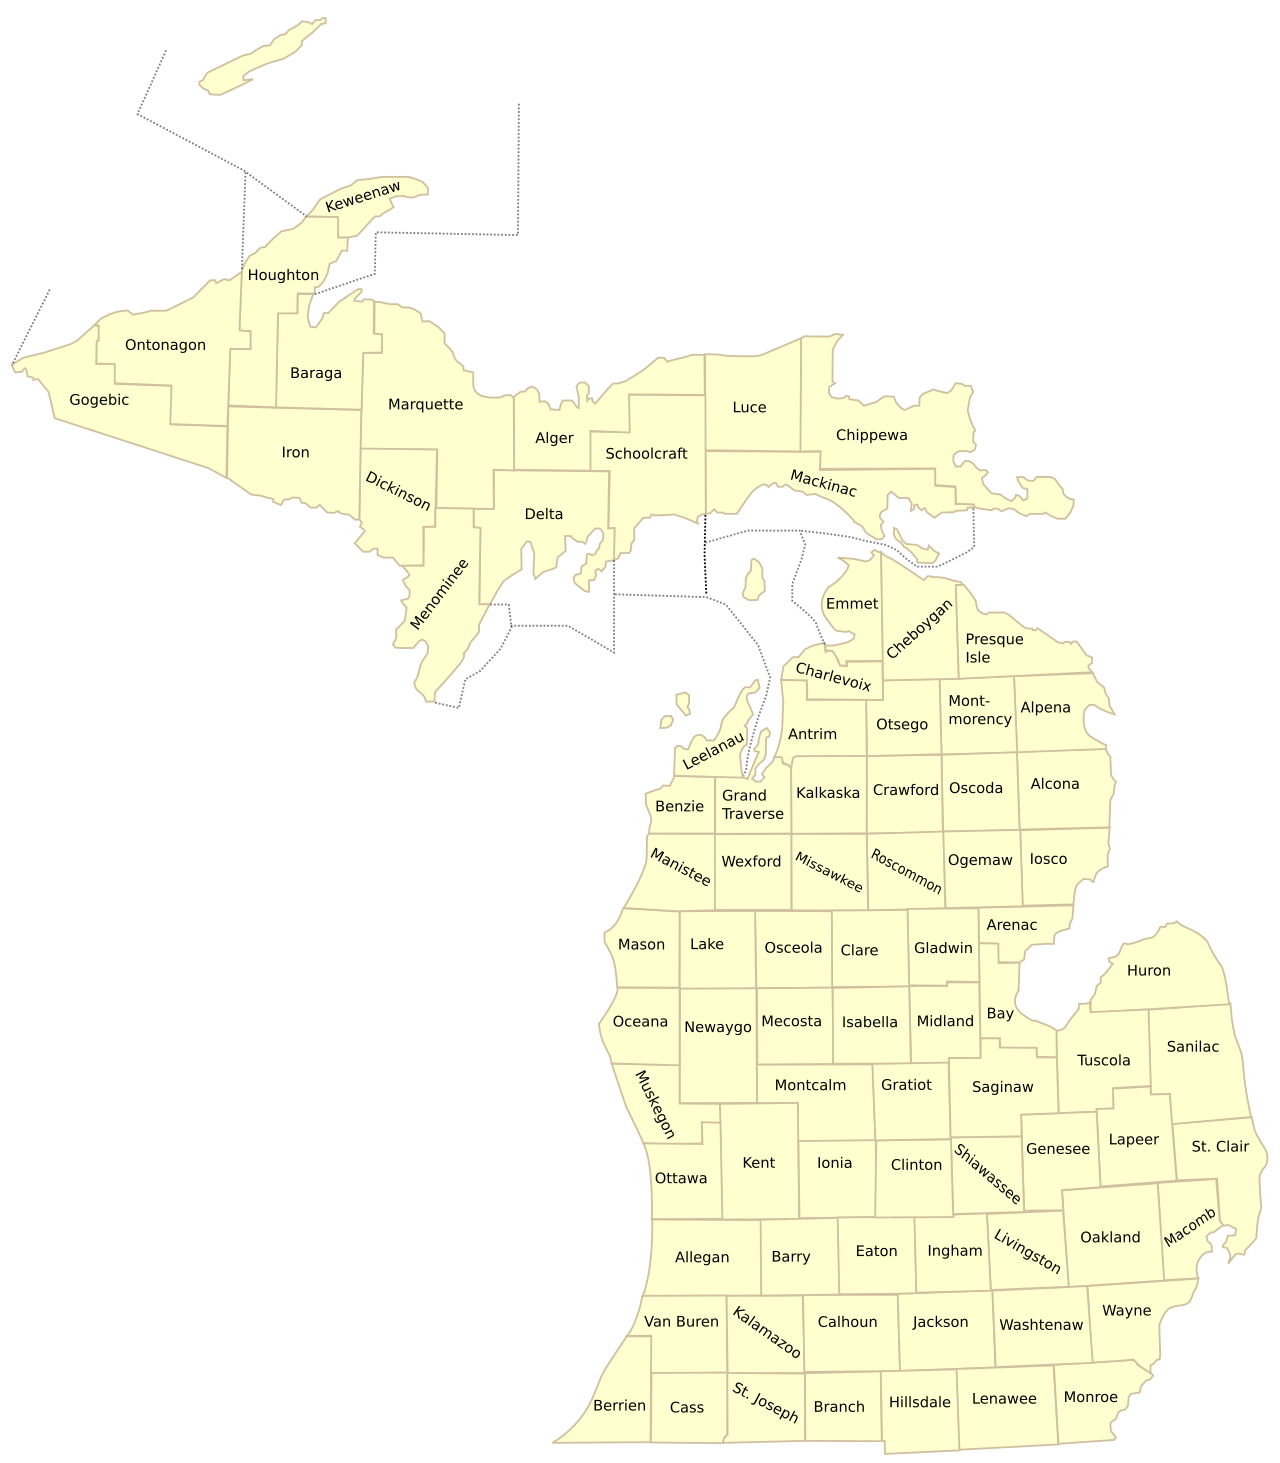
Download Official High-Resolution Michigan County Maps
Download vector PDF maps showing complete county boundaries, geographic acreage, and municipal seats.
Official Rankings: All 83 Michigan Counties by Land Area (Rank 1 to 83)
Ranked by total land square mileage, total area (including Great Lakes territorial waters), and water coverage percentage.
| Rank | County Name | Land Area | Total Area | Water Area | % Water | County Seat | Region |
|---|---|---|---|---|---|---|---|
| #1 | Marquette County | 1,808 sq mi | 3,425 sq mi | 1,617 sq mi | 47.2% | Marquette | Upper Peninsula Hub |
| #2 | Chippewa County | 1,561 sq mi | 2,698 sq mi | 1,137 sq mi | 42.1% | Sault Ste. Marie | Upper Peninsula |
| #3 | Ontonagon County | 1,311 sq mi | 3,741 sq mi | 2,430 sq mi | 65.0% | Ontonagon | Upper Peninsula |
| #4 | Schoolcraft County | 1,178 sq mi | 1,884 sq mi | 706 sq mi | 37.5% | Manistique | Upper Peninsula |
| #5 | Delta County | 1,171 sq mi | 1,992 sq mi | 821 sq mi | 41.2% | Escanaba | Upper Peninsula |
| #6 | Iron County | 1,166 sq mi | 1,211 sq mi | 45 sq mi | 3.7% | Crystal Falls | Upper Peninsula (Central Time) |
| #7 | Gogebic County | 1,102 sq mi | 1,476 sq mi | 374 sq mi | 25.3% | Bessemer | Upper Peninsula (Central Time) |
| #8 | Menominee County | 1,044 sq mi | 1,338 sq mi | 294 sq mi | 22.0% | Menominee | Upper Peninsula (Central Time) |
| #9 | Mackinac County | 1,022 sq mi | 2,101 sq mi | 1,079 sq mi | 51.4% | St. Ignace | Upper Peninsula (Straits) |
| #10 | Houghton County | 1,012 sq mi | 1,502 sq mi | 490 sq mi | 32.6% | Houghton | Upper Peninsula |
| #11 | Sanilac County | 963 sq mi | 1,590 sq mi | 627 sq mi | 39.4% | Sandusky | The Thumb |
| #12 | Alger County | 918 sq mi | 5,049 sq mi | 4,131 sq mi | 81.8% | Munising | Upper Peninsula |
| #13 | Baraga County | 904 sq mi | 1,069 sq mi | 165 sq mi | 15.4% | L’Anse | Upper Peninsula |
| #14 | Luce County | 903 sq mi | 1,912 sq mi | 1,009 sq mi | 52.8% | Newberry | Upper Peninsula |
| #15 | Oakland County | 868 sq mi | 907 sq mi | 39 sq mi | 4.3% | Pontiac | Metro Detroit Hub |
| #16 | Kent County | 847 sq mi | 872 sq mi | 25 sq mi | 2.9% | Grand Rapids | West Michigan Hub |
| #17 | Newaygo County | 842 sq mi | 861 sq mi | 19 sq mi | 2.2% | White Cloud | West Central Michigan |
| #18 | Huron County | 836 sq mi | 2,137 sq mi | 1,301 sq mi | 60.9% | Bad Axe | The Thumb |
| #19 | Allegan County | 825 sq mi | 1,833 sq mi | 1,008 sq mi | 55.0% | Allegan | West Michigan |
| #20 | Tuscola County | 803 sq mi | 1,125 sq mi | 322 sq mi | 28.6% | Caro | The Thumb |
| #21 | Saginaw County | 800 sq mi | 816 sq mi | 16 sq mi | 2.0% | Saginaw | Great Lakes Bay |
| #22 | Dickinson County | 761 sq mi | 777 sq mi | 16 sq mi | 2.1% | Iron Mountain | Upper Peninsula (Central Time) |
| #23 | Lenawee County | 750 sq mi | 761 sq mi | 11 sq mi | 1.4% | Adrian | Southern Border |
| #24 | St. Clair County | 721 sq mi | 837 sq mi | 116 sq mi | 13.9% | Port Huron | Blue Water / The Thumb |
| #25 | Cheboygan County | 715 sq mi | 885 sq mi | 170 sq mi | 19.2% | Cheboygan | Northern Lower |
| #26 | Jackson County | 707 sq mi | 723 sq mi | 16 sq mi | 2.2% | Jackson | South Central Michigan |
| #27 | Montcalm County | 707 sq mi | 721 sq mi | 14 sq mi | 1.9% | Stanton | Central Michigan |
| #28 | Calhoun County | 706 sq mi | 718 sq mi | 12 sq mi | 1.7% | Marshall | Southwest Michigan |
| #29 | Washtenaw County | 706 sq mi | 722 sq mi | 16 sq mi | 2.2% | Ann Arbor | Southeast Michigan |
| #30 | Alcona County | 674 sq mi | 1,791 sq mi | 1,117 sq mi | 62.4% | Harrisville | Northern Lower |
| #31 | Presque Isle County | 659 sq mi | 2,573 sq mi | 1,914 sq mi | 74.4% | Rogers City | Northern Lower |
| #32 | Lapeer County | 654 sq mi | 663 sq mi | 9 sq mi | 1.4% | Lapeer | The Thumb / Metro Fringe |
| #33 | Genesee County | 637 sq mi | 649 sq mi | 12 sq mi | 1.8% | Flint | Flint / Mid-Michigan |
| #34 | Van Buren County | 607 sq mi | 1,090 sq mi | 483 sq mi | 44.3% | Paw Paw | Southwest Michigan Coast |
| #35 | Hillsdale County | 598 sq mi | 607 sq mi | 9 sq mi | 1.5% | Hillsdale | Southern Border |
| #36 | Wayne County | 597 sq mi | 672 sq mi | 75 sq mi | 11.2% | Detroit | Metro Detroit Urban Core |
| #37 | Eaton County | 576 sq mi | 579 sq mi | 3 sq mi | 0.5% | Charlotte | Mid-Michigan |
| #38 | Alpena County | 574 sq mi | 1,695 sq mi | 1,121 sq mi | 66.1% | Alpena | Northern Lower |
| #39 | Isabella County | 572 sq mi | 578 sq mi | 6 sq mi | 1.0% | Mt. Pleasant | Central Michigan |
| #40 | Ionia County | 571 sq mi | 580 sq mi | 9 sq mi | 1.6% | Ionia | West Michigan |
| #41 | Gratiot County | 570 sq mi | 572 sq mi | 2 sq mi | 0.3% | Ithaca | Central Michigan |
| #42 | Clinton County | 569 sq mi | 575 sq mi | 6 sq mi | 1.0% | St. Johns | Mid-Michigan |
| #43 | Berrien County | 568 sq mi | 1,581 sq mi | 1,013 sq mi | 64.1% | St. Joseph | Southwest Michigan |
| #44 | Lake County | 568 sq mi | 575 sq mi | 7 sq mi | 1.2% | Baldwin | West Central Michigan |
| #45 | Clare County | 567 sq mi | 575 sq mi | 8 sq mi | 1.4% | Harrison | Central Michigan |
| #46 | Osceola County | 566 sq mi | 573 sq mi | 7 sq mi | 1.2% | Reed City | Central Michigan |
| #47 | Livingston County | 565 sq mi | 585 sq mi | 20 sq mi | 3.4% | Howell | Metro Detroit Fringe |
| #48 | Missaukee County | 565 sq mi | 574 sq mi | 9 sq mi | 1.6% | Lake City | Northern Lower |
| #49 | Oscoda County | 565 sq mi | 572 sq mi | 7 sq mi | 1.2% | Mio | Northern Lower |
| #50 | Wexford County | 565 sq mi | 576 sq mi | 11 sq mi | 1.9% | Cadillac | Northern Lower |
| #51 | Ogemaw County | 563 sq mi | 575 sq mi | 12 sq mi | 2.1% | West Branch | Northern Lower |
| #52 | Ottawa County | 563 sq mi | 1,632 sq mi | 1,069 sq mi | 65.5% | Grand Haven | West Michigan Lakeshore |
| #53 | Kalamazoo County | 561 sq mi | 580 sq mi | 19 sq mi | 3.3% | Kalamazoo | Southwest Michigan |
| #54 | Kalkaska County | 560 sq mi | 571 sq mi | 11 sq mi | 1.9% | Kalkaska | Northern Lower |
| #55 | Crawford County | 556 sq mi | 563 sq mi | 7 sq mi | 1.2% | Grayling | Northern Lower |
| #56 | Ingham County | 556 sq mi | 561 sq mi | 5 sq mi | 0.9% | Mason | Capital Region |
| #57 | Mecosta County | 555 sq mi | 567 sq mi | 12 sq mi | 2.1% | Big Rapids | Central Michigan |
| #58 | Barry County | 553 sq mi | 577 sq mi | 24 sq mi | 4.2% | Hastings | West Michigan |
| #59 | Monroe County | 551 sq mi | 680 sq mi | 129 sq mi | 19.0% | Monroe | Lake Erie Shoreline |
| #60 | Iosco County | 549 sq mi | 1,891 sq mi | 1,342 sq mi | 71.0% | Tawas City | Northern Lower |
| #61 | Montmorency County | 548 sq mi | 563 sq mi | 15 sq mi | 2.7% | Atlanta | Northern Lower |
| #62 | Manistee County | 542 sq mi | 1,281 sq mi | 739 sq mi | 57.7% | Manistee | Northern Lower |
| #63 | Keweenaw County | 541 sq mi | 5,966 sq mi | 5,425 sq mi | 90.9% | Eagle River | Upper Peninsula (Copper Country) |
| #64 | Shiawassee County | 531 sq mi | 541 sq mi | 10 sq mi | 1.8% | Corunna | Mid-Michigan |
| #65 | Roscommon County | 520 sq mi | 580 sq mi | 60 sq mi | 10.3% | Roscommon | Northern Lower |
| #66 | Midland County | 518 sq mi | 528 sq mi | 10 sq mi | 1.9% | Midland | Great Lakes Bay |
| #67 | Otsego County | 515 sq mi | 526 sq mi | 11 sq mi | 2.1% | Gaylord | Northern Lower |
| #68 | Oceana County | 512 sq mi | 1,307 sq mi | 795 sq mi | 60.8% | Hart | West Michigan Coast |
| #69 | Branch County | 506 sq mi | 520 sq mi | 14 sq mi | 2.7% | Coldwater | Southern Border |
| #70 | Gladwin County | 502 sq mi | 516 sq mi | 14 sq mi | 2.7% | Gladwin | Central Michigan |
| #71 | St. Joseph County | 501 sq mi | 521 sq mi | 20 sq mi | 3.8% | Centreville | Southern Border |
| #72 | Muskegon County | 499 sq mi | 1,459 sq mi | 960 sq mi | 65.8% | Muskegon | West Michigan Coast |
| #73 | Mason County | 495 sq mi | 1,242 sq mi | 747 sq mi | 60.1% | Ludington | West Michigan Coast |
| #74 | Cass County | 490 sq mi | 508 sq mi | 18 sq mi | 3.5% | Cassopolis | Southwest Michigan |
| #75 | Macomb County | 479 sq mi | 570 sq mi | 91 sq mi | 16.0% | Mount Clemens | Metro Detroit / Lake St. Clair |
| #76 | Antrim County | 477 sq mi | 602 sq mi | 125 sq mi | 20.8% | Bellaire | Northern Lower |
| #77 | Emmet County | 468 sq mi | 882 sq mi | 414 sq mi | 46.9% | Petoskey | Northern Lower |
| #78 | Grand Traverse County | 465 sq mi | 601 sq mi | 136 sq mi | 22.6% | Traverse City | Northern Lower |
| #79 | Bay County | 444 sq mi | 631 sq mi | 187 sq mi | 29.6% | Bay City | Great Lakes Bay |
| #80 | Charlevoix County | 417 sq mi | 1,391 sq mi | 974 sq mi | 70.0% | Charlevoix | Northern Lower |
| #81 | Arenac County | 367 sq mi | 681 sq mi | 314 sq mi | 46.1% | Standish | Mid-Michigan |
| #82 | Leelanau County | 347 sq mi | 2,532 sq mi | 2,185 sq mi | 86.3% | Suttons Bay | Northern Lower |
| #83 | Benzie County | 321 sq mi | 860 sq mi | 539 sq mi | 62.7% | Beulah | Northern Lower |
Total Area vs. Land Area Discrepancies: The Great Lakes Boundary Effect
When analyzing the cartographic dimensions of Michigan counties, geographers and census statisticians make a sharp distinction between total geographic area and dry land area. Because Michigan is surrounded by four Great Lakes—Superior, Michigan, Huron, and Erie—state and county administrative borders extend outwards into the open water to meet interstate and international borders with Canada, Wisconsin, Minnesota, and Ohio.
Notable Great Lakes Water Area Anomalies:
- Keweenaw County: While Keweenaw ranks as Michigan’s smallest county by actual dry land area (540 square miles), its official total jurisdiction covers a staggering 5,966 square miles—over 90% of which is the open water of Lake Superior surrounding the Keweenaw Peninsula and Isle Royale!
- Mackinac & Chippewa Counties: Spanning the Straits of Mackinac and St. Marys River, both counties possess vast water jurisdictions covering hundreds of square miles of Great Lakes shipping straits, connecting islands like Mackinac Island, Bois Blanc, and Drummond Island to the mainland.
- Alcona, Alpena & Presque Isle: These northeast Lower Peninsula counties feature land areas between 650 and 680 square miles, but each oversees more than 1,000 square miles of open Lake Huron waters, home to the protected Thunder Bay National Marine Sanctuary.
Population Density Extremes: Square Miles vs. Human Population
Comparing land area directly with population density highlights Michigan’s striking demographic duality. Michigan’s largest counties by land area are primarily located in the Upper Peninsula and Northern Lower Peninsula, where vast wilderness expanses result in extremely low population densities:
- Marquette County (Rank 1 Area): Spans 1,808 square miles of land area with a population of approximately 66,000 residents, producing a rural density of only 36.5 people per square mile.
- Ontonagon County (Rank 3 Area): Spans 1,311 square miles of land area with only 5,800 residents, yielding an ultra-sparse density of just 4.4 people per square mile.
- Wayne County (Rank 50 Area): Encompasses only 612 square miles of land area yet houses nearly 1.8 million residents, resulting in a dense metropolitan concentration of nearly 2,900 people per square mile.
This dramatic divergence illustrates why standardized land area measurements are vital for state infrastructure planning, highway maintenance funding formulas, emergency medical response routing, and public school transportation allocation.
The Evolution of Michigan’s 83 County Boundaries
The contemporary land area rankings of Michigan’s 83 counties are the result of more than a century of territorial carving, administrative partitioning, and legislative restructuring. When Wayne County was originally organized by Territorial Governor Arthur St. Clair in 1796 under the Northwest Ordinance, its colossal borders encompassed almost all of modern Michigan, plus vast northern territories in present-day Ohio, Indiana, and Wisconsin (including Milwaukee and Chicago)!
As pioneers surged into southern Michigan following the 1825 opening of the Erie Canal, territorial governors Lewis Cass and Stevens T. Mason methodically carved smaller, accessible counties along regular survey lines. Between 1831 and 1840, the state legislature pre-named dozens of unorganized northern counties—often utilizing Native American words or honoring Irish revolutionary heroes (such as Clare, Roscommon, and Antrim counties). By 1891, with the organization of Dickinson County from portions of Iron, Marquette, and Menominee counties, Michigan’s final 83-county cartographic mosaic was permanently established.
Frequently Asked Questions: Michigan Counties by Area
What is the largest county in Michigan by land area?
Marquette County in the Upper Peninsula is the largest county in Michigan by land area, encompassing 1,808 square miles of dense northern forest, iron ranges, and Lake Superior shoreline.
Why is Keweenaw County listed as having over 5,900 square miles?
Under Michigan and federal territorial law, county borders extend to international and state water boundaries. Keweenaw County encompasses only 541 square miles of dry land, but contains 5,425 square miles of Lake Superior water, including Isle Royale National Park, giving it a total jurisdictional area of 5,966 square miles.
What is the smallest county in Michigan by land area?
Benzie County in northwest lower Michigan is the smallest county by land area at 321 square miles. Cass County in southwest Michigan is the second smallest at 490 square miles.