
Michigan Counties by Population: Complete 2026 Rankings (1 to 83), Growth & Density Map
A definitive cartographic and statistical census guide ranking all 83 counties in the Great Lakes State from largest to smallest. Includes real-time population counts, 10-year growth shifts, land density figures, regional hub breakdowns, and instant PDF map downloads.
Download Official High-Resolution Michigan County Maps
Accurate vector PDF downloads optimized for standard letter printing (8.5″ x 11″) and GIS classroom reference.
Official Michigan Counties Population Rankings (Rank 1 to 83)
Ranked from most populous to least populous county based on 2026 official estimates and U.S. Census decennial benchmarks.
| Rank | County Name | 2026 Population | 2020 Census | Growth | Land Area | Density | County Seat | Region |
|---|---|---|---|---|---|---|---|---|
| #1 | Wayne County | 1,793,561 | 1,793,561 | 0.0% | 597 sq mi | 3,004.3 /sq mi | Detroit | Metro Detroit Urban Core |
| #2 | Oakland County | 1,274,395 | 1,274,395 | 0.0% | 868 sq mi | 1,468.2 /sq mi | Pontiac | Metro Detroit Hub |
| #3 | Macomb County | 881,217 | 881,217 | 0.0% | 479 sq mi | 1,839.7 /sq mi | Mount Clemens | Metro Detroit / Lake St. Clair |
| #4 | Kent County | 657,974 | 657,974 | 0.0% | 847 sq mi | 776.8 /sq mi | Grand Rapids | West Michigan Hub |
| #5 | Genesee County | 406,211 | 406,211 | 0.0% | 637 sq mi | 637.7 /sq mi | Flint | Flint / Mid-Michigan |
| #6 | Washtenaw County | 372,258 | 372,258 | 0.0% | 706 sq mi | 527.3 /sq mi | Ann Arbor | Southeast Michigan |
| #7 | Ottawa County | 296,200 | 296,200 | 0.0% | 563 sq mi | 526.1 /sq mi | Grand Haven | West Michigan Lakeshore |
| #8 | Ingham County | 284,900 | 284,900 | 0.0% | 556 sq mi | 512.4 /sq mi | Mason | Capital Region |
| #9 | Kalamazoo County | 261,670 | 261,670 | 0.0% | 561 sq mi | 466.4 /sq mi | Kalamazoo | Southwest Michigan |
| #10 | Livingston County | 194,385 | 193,857 | +0.27% | 565 sq mi | 344.0 /sq mi | Howell | Metro Detroit Fringe |
| #11 | Saginaw County | 189,591 | 189,591 | 0.0% | 800 sq mi | 237.0 /sq mi | Saginaw | Great Lakes Bay |
| #12 | Muskegon County | 176,511 | 175,824 | +0.39% | 499 sq mi | 353.7 /sq mi | Muskegon | West Michigan Coast |
| #13 | St. Clair County | 160,383 | 160,383 | 0.0% | 721 sq mi | 222.4 /sq mi | Port Huron | Blue Water / The Thumb |
| #14 | Jackson County | 160,366 | 160,366 | 0.0% | 707 sq mi | 226.8 /sq mi | Jackson | South Central Michigan |
| #15 | Monroe County | 155,274 | 155,274 | 0.0% | 551 sq mi | 281.8 /sq mi | Monroe | Lake Erie Shoreline |
| #16 | Berrien County | 154,316 | 154,316 | 0.0% | 568 sq mi | 271.7 /sq mi | St. Joseph | Southwest Michigan |
| #17 | Calhoun County | 134,310 | 134,310 | 0.0% | 706 sq mi | 190.2 /sq mi | Marshall | Southwest Michigan |
| #18 | Allegan County | 120,502 | 120,560 | -0.05% | 825 sq mi | 146.1 /sq mi | Allegan | West Michigan |
| #19 | Eaton County | 109,175 | 109,175 | 0.0% | 576 sq mi | 189.5 /sq mi | Charlotte | Mid-Michigan |
| #20 | Bay County | 103,856 | 103,856 | 0.0% | 444 sq mi | 233.9 /sq mi | Bay City | Great Lakes Bay |
| #21 | Lenawee County | 99,423 | 99,423 | 0.0% | 750 sq mi | 132.6 /sq mi | Adrian | Southern Border |
| #22 | Grand Traverse County | 95,238 | 95,238 | 0.0% | 465 sq mi | 204.8 /sq mi | Traverse City | Northern Lower |
| #23 | Lapeer County | 88,619 | 88,619 | 0.0% | 654 sq mi | 135.5 /sq mi | Lapeer | The Thumb / Metro Fringe |
| #24 | Midland County | 83,494 | 83,494 | 0.0% | 518 sq mi | 161.2 /sq mi | Midland | Great Lakes Bay |
| #25 | Clinton County | 79,128 | 79,128 | 0.0% | 569 sq mi | 139.1 /sq mi | St. Johns | Mid-Michigan |
| #26 | Van Buren County | 75,587 | 75,587 | 0.0% | 607 sq mi | 124.5 /sq mi | Paw Paw | Southwest Michigan Coast |
| #27 | Shiawassee County | 68,094 | 68,094 | 0.0% | 531 sq mi | 128.2 /sq mi | Corunna | Mid-Michigan |
| #28 | Ionia County | 66,804 | 66,804 | 0.0% | 571 sq mi | 117.0 /sq mi | Ionia | West Michigan |
| #29 | Montcalm County | 66,614 | 66,614 | 0.0% | 707 sq mi | 94.2 /sq mi | Stanton | Central Michigan |
| #30 | Marquette County | 66,017 | 66,017 | 0.0% | 1,808 sq mi | 36.5 /sq mi | Marquette | Upper Peninsula Hub |
| #31 | Isabella County | 64,394 | 64,394 | 0.0% | 572 sq mi | 112.6 /sq mi | Mt. Pleasant | Central Michigan |
| #32 | Barry County | 62,422 | 62,422 | 0.0% | 553 sq mi | 112.9 /sq mi | Hastings | West Michigan |
| #33 | St. Joseph County | 60,939 | 60,939 | 0.0% | 501 sq mi | 121.6 /sq mi | Centreville | Southern Border |
| #34 | Tuscola County | 53,323 | 53,323 | 0.0% | 803 sq mi | 66.4 /sq mi | Caro | The Thumb |
| #35 | Cass County | 51,589 | 51,589 | 0.0% | 490 sq mi | 105.3 /sq mi | Cassopolis | Southwest Michigan |
| #36 | Newaygo County | 49,978 | 49,978 | 0.0% | 842 sq mi | 59.4 /sq mi | White Cloud | West Central Michigan |
| #37 | Hillsdale County | 45,742 | 45,742 | 0.0% | 598 sq mi | 76.5 /sq mi | Hillsdale | Southern Border |
| #38 | Branch County | 44,862 | 44,862 | 0.0% | 506 sq mi | 88.7 /sq mi | Coldwater | Southern Border |
| #39 | Gratiot County | 41,761 | 41,761 | 0.0% | 570 sq mi | 73.3 /sq mi | Ithaca | Central Michigan |
| #40 | Sanilac County | 40,611 | 40,611 | 0.0% | 963 sq mi | 42.2 /sq mi | Sandusky | The Thumb |
| #41 | Mecosta County | 39,714 | 39,714 | 0.0% | 555 sq mi | 71.6 /sq mi | Big Rapids | Central Michigan |
| #42 | Houghton County | 37,361 | 37,361 | 0.0% | 1,012 sq mi | 36.9 /sq mi | Houghton | Upper Peninsula |
| #43 | Delta County | 36,903 | 36,903 | 0.0% | 1,171 sq mi | 31.5 /sq mi | Escanaba | Upper Peninsula |
| #44 | Chippewa County | 36,785 | 36,785 | 0.0% | 1,561 sq mi | 23.6 /sq mi | Sault Ste. Marie | Upper Peninsula |
| #45 | Emmet County | 34,057 | 34,057 | 0.0% | 468 sq mi | 72.8 /sq mi | Petoskey | Northern Lower |
| #46 | Wexford County | 33,673 | 33,673 | 0.0% | 565 sq mi | 59.6 /sq mi | Cadillac | Northern Lower |
| #47 | Huron County | 31,407 | 31,407 | 0.0% | 836 sq mi | 37.6 /sq mi | Bad Axe | The Thumb |
| #48 | Clare County | 30,856 | 30,856 | 0.0% | 567 sq mi | 54.4 /sq mi | Harrison | Central Michigan |
| #49 | Mason County | 29,052 | 29,052 | 0.0% | 495 sq mi | 58.7 /sq mi | Ludington | West Michigan Coast |
| #50 | Alpena County | 28,907 | 28,907 | 0.0% | 574 sq mi | 50.4 /sq mi | Alpena | Northern Lower |
| #51 | Oceana County | 26,585 | 26,585 | 0.0% | 512 sq mi | 51.9 /sq mi | Hart | West Michigan Coast |
| #52 | Charlevoix County | 26,054 | 26,054 | 0.0% | 417 sq mi | 62.5 /sq mi | Charlevoix | Northern Lower |
| #53 | Dickinson County | 25,947 | 25,947 | 0.0% | 761 sq mi | 34.1 /sq mi | Iron Mountain | Upper Peninsula (Central Time) |
| #54 | Cheboygan County | 25,579 | 25,579 | 0.0% | 715 sq mi | 35.8 /sq mi | Cheboygan | Northern Lower |
| #55 | Gladwin County | 25,386 | 25,386 | 0.0% | 502 sq mi | 50.6 /sq mi | Gladwin | Central Michigan |
| #56 | Iosco County | 25,237 | 25,237 | 0.0% | 549 sq mi | 46.0 /sq mi | Tawas City | Northern Lower |
| #57 | Otsego County | 25,091 | 25,091 | 0.0% | 515 sq mi | 48.7 /sq mi | Gaylord | Northern Lower |
| #58 | Manistee County | 25,032 | 25,032 | 0.0% | 542 sq mi | 46.2 /sq mi | Manistee | Northern Lower |
| #59 | Menominee County | 23,502 | 23,502 | 0.0% | 1,044 sq mi | 22.5 /sq mi | Menominee | Upper Peninsula (Central Time) |
| #60 | Roscommon County | 23,459 | 23,459 | 0.0% | 520 sq mi | 45.1 /sq mi | Roscommon | Northern Lower |
| #61 | Antrim County | 23,431 | 23,431 | 0.0% | 477 sq mi | 49.1 /sq mi | Bellaire | Northern Lower |
| #62 | Osceola County | 22,891 | 22,891 | 0.0% | 566 sq mi | 40.4 /sq mi | Reed City | Central Michigan |
| #63 | Leelanau County | 22,301 | 22,301 | 0.0% | 347 sq mi | 64.3 /sq mi | Suttons Bay | Northern Lower |
| #64 | Ogemaw County | 20,770 | 20,770 | 0.0% | 563 sq mi | 36.9 /sq mi | West Branch | Northern Lower |
| #65 | Benzie County | 17,970 | 17,970 | 0.0% | 321 sq mi | 56.0 /sq mi | Beulah | Northern Lower |
| #66 | Kalkaska County | 17,939 | 17,939 | 0.0% | 560 sq mi | 32.0 /sq mi | Kalkaska | Northern Lower |
| #67 | Missaukee County | 15,052 | 15,052 | 0.0% | 565 sq mi | 26.6 /sq mi | Lake City | Northern Lower |
| #68 | Arenac County | 15,002 | 15,002 | 0.0% | 367 sq mi | 40.9 /sq mi | Standish | Mid-Michigan |
| #69 | Gogebic County | 14,380 | 14,380 | 0.0% | 1,102 sq mi | 13.0 /sq mi | Bessemer | Upper Peninsula (Central Time) |
| #70 | Crawford County | 12,988 | 12,988 | 0.0% | 556 sq mi | 23.4 /sq mi | Grayling | Northern Lower |
| #71 | Presque Isle County | 12,982 | 12,982 | 0.0% | 659 sq mi | 19.7 /sq mi | Rogers City | Northern Lower |
| #72 | Lake County | 12,096 | 12,096 | 0.0% | 568 sq mi | 21.3 /sq mi | Baldwin | West Central Michigan |
| #73 | Iron County | 11,631 | 11,631 | 0.0% | 1,166 sq mi | 10.0 /sq mi | Crystal Falls | Upper Peninsula (Central Time) |
| #74 | Mackinac County | 10,834 | 10,834 | 0.0% | 1,022 sq mi | 10.6 /sq mi | St. Ignace | Upper Peninsula (Straits) |
| #75 | Alcona County | 10,167 | 10,142 | +0.25% | 674 sq mi | 15.1 /sq mi | Harrisville | Northern Lower |
| #76 | Montmorency County | 9,153 | 9,153 | 0.0% | 548 sq mi | 16.7 /sq mi | Atlanta | Northern Lower |
| #77 | Alger County | 8,769 | 8,842 | -0.83% | 918 sq mi | 9.6 /sq mi | Munising | Upper Peninsula |
| #78 | Oscoda County | 8,219 | 8,219 | 0.0% | 565 sq mi | 14.5 /sq mi | Mio | Northern Lower |
| #79 | Baraga County | 8,158 | 8,158 | 0.0% | 904 sq mi | 9.0 /sq mi | L’Anse | Upper Peninsula |
| #80 | Schoolcraft County | 8,047 | 8,047 | 0.0% | 1,178 sq mi | 6.8 /sq mi | Manistique | Upper Peninsula |
| #81 | Ontonagon County | 5,811 | 5,811 | 0.0% | 1,311 sq mi | 4.4 /sq mi | Ontonagon | Upper Peninsula |
| #82 | Luce County | 5,339 | 5,339 | 0.0% | 903 sq mi | 5.9 /sq mi | Newberry | Upper Peninsula |
| #83 | Keweenaw County | 2,172 | 2,046 | +6.16% | 541 sq mi | 4.0 /sq mi | Eagle River | Upper Peninsula (Copper Country) |
Michigan Statewide County Distribution Map
This high-resolution cartographic map displays all 83 county boundaries across Michigan’s Upper and Lower Peninsulas. Population density is heavily concentrated in Southeast Michigan along the I-75 and I-94 corridors, and throughout West Michigan centered on Kent and Ottawa counties.
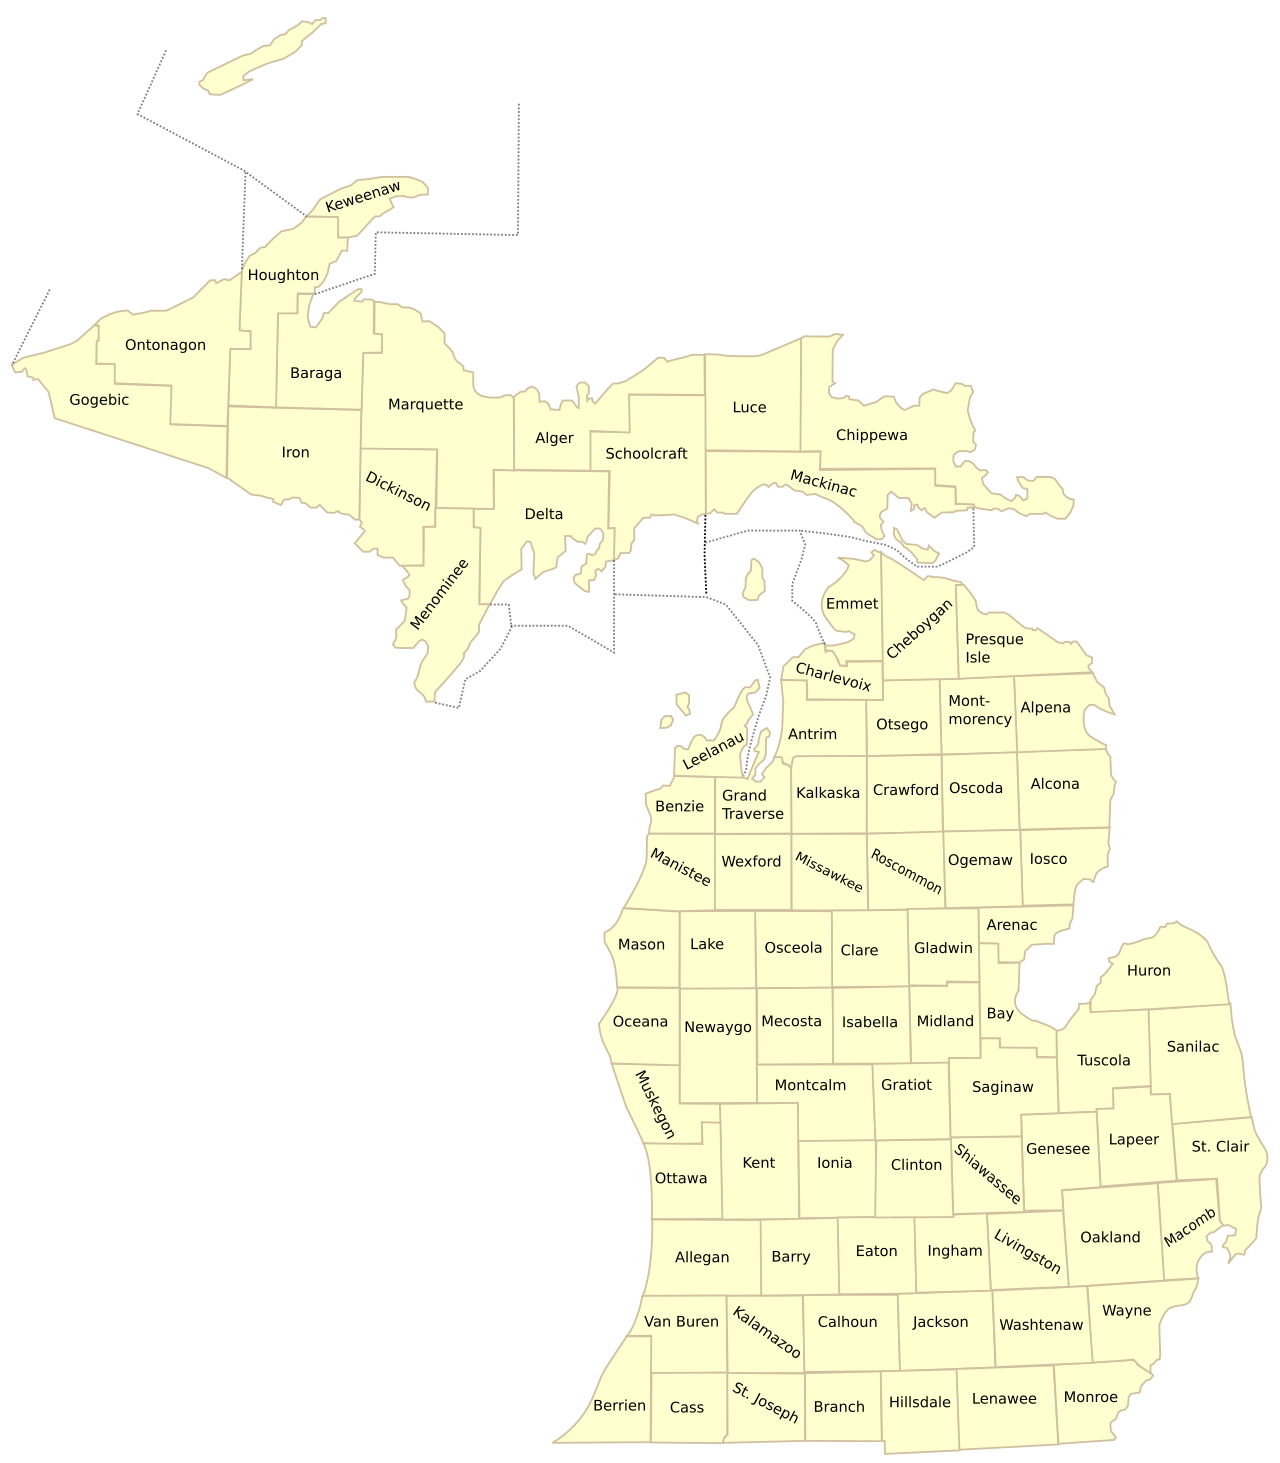
Figure 1: Michigan County Cartographic Reference Map illustrating all 83 administrative borders and regional population clusters.
Demographic Analysis: Understanding Michigan’s Population Distribution
1. The “Big Three” Metro Detroit Powerhouses
Southeast Michigan is anchored by the tri-county triumvirate of Wayne County (#1, 1.79M), Oakland County (#2, 1.27M), and Macomb County (#3, 881K). Combined, these three counties account for nearly 40% of the entire state’s population. Wayne County boasts the highest density at 3,004 residents per square mile, while Oakland County represents one of the nation’s wealthiest suburban employment and technology corridors.
2. The West Michigan Economic Growth Boom
While Southeast Michigan has stabilized, West Michigan has emerged as Michigan’s most vigorous economic engine. Kent County (#4, 657K, home to Grand Rapids) and neighboring Ottawa County (#7, 296K, including Holland and Grand Haven) have consistently outpaced statewide growth rates, propelled by robust manufacturing, healthcare innovation, and lakefront appeal.
3. Mid-Michigan University & Government Hubs
In the central region, Washtenaw County (#6, 372K, Ann Arbor and the University of Michigan) and Ingham County (#8, 284K, Lansing state capital and Michigan State University) maintain stable, highly educated populations driven by state governance, premier research universities, and bio-tech spinoffs.
4. Upper Peninsula & Rural Wilderness Scale
In stark contrast to the urban south, Michigan’s 15 Upper Peninsula counties account for nearly 29% of Michigan’s land area but under 3% of its total residents. The regional hub of Marquette County leads the U.P. with 66,017 residents, while Keweenaw County holds the title of Michigan’s least populated county at just 2,172 citizens.
Explore Michigan County Map Resources
Access our full collection of county directories, high-definition cartographic maps, and printable templates:
Frequently Asked Questions: Michigan Counties by Population
What is the most populated county in Michigan?
Wayne County is the most populous county in Michigan, home to an estimated 1,793,561 residents. Serving as the home of Detroit, Dearborn, and Livonia, Wayne County contains almost 18% of Michigan’s entire population and features an impressive population density of 3,004 people per square mile.
What is the least populated county in Michigan?
Keweenaw County, situated at the rugged northernmost tip of the Keweenaw Peninsula in the Upper Peninsula, is Michigan’s smallest county by population with approximately 2,172 residents. Spread across 541 square miles of land, its population density is only 4.0 people per square mile.
Which Michigan counties have more than 1 million residents?
Only two Michigan counties cross the one-million-resident threshold: Wayne County (approx. 1,793,561) and Oakland County (approx. 1,274,395). The third closest is Macomb County with 881,217 residents.
What are the top 10 largest counties in Michigan by population?
The 10 largest Michigan counties by population are:
- Wayne County (1,793,561)
- Oakland County (1,274,395)
- Macomb County (881,217)
- Kent County (657,974)
- Genesee County (406,211)
- Washtenaw County (372,258)
- Ottawa County (296,200)
- Ingham County (284,900)
- Kalamazoo County (261,670)
- Livingston County (194,385)
What is the fastest growing region in Michigan?
West Michigan is historically Michigan’s fastest-growing region, highlighted by Ottawa County and Kent County. Outside of West Michigan, Grand Traverse County in the northern Lower Peninsula and Livingston County along the suburban Detroit fringe have also posted sustained population increases.